

Picture scrolling through property listings in Burnley and seeing house prices up 5.5% in a year, or finding average values in Waltham Forest nearly doubled over the past decade. These aren’t outliers. Across specific pockets of the UK, house sales activity has surged while other regions have stalled. The pattern is clear: buyers are migrating towards affordability, and that shift is reshaping where the strongest house sales growth happens.
The UK’s Property Hotspots for 2025-2026
Recent data from Rightmove and Zoopla shows a divided market. Northern England and Scotland are pulling ahead, while southern regions struggle with affordability pressures and higher stamp duty costs.
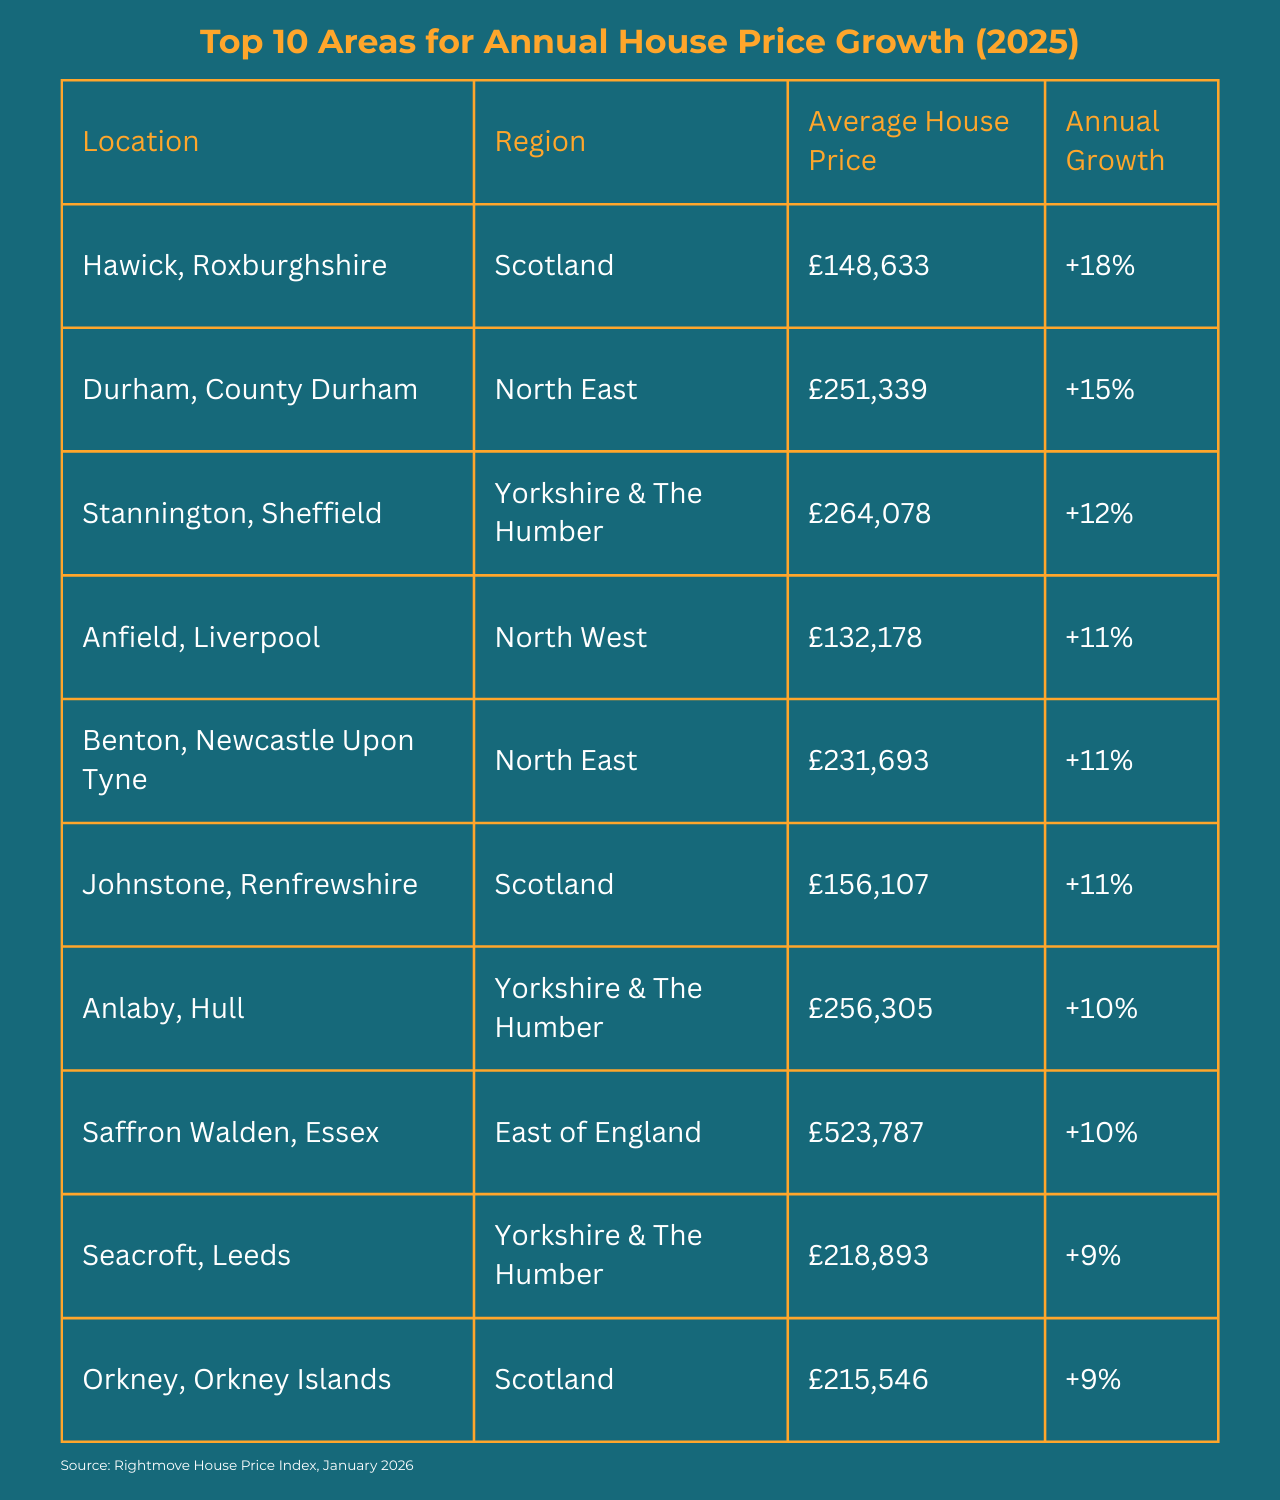 These areas have something in common: affordability. Out of the 50 strongest-performing areas for house sales growth, 43 remain below the national average house price of £368,031. The average asking price across these top performers sits at £270,711 – roughly £100,000 (26%) below the UK average.
London’s Decade-Long Transformation
While 2025 focused on northern towns, London’s story plays out over a longer timeframe. East and South London boroughs have seen some of the most dramatic house sales value increases since 2013, driven by transport improvements and regeneration.
Top 10 London Boroughs for Decade Growth (2013-2023)
According to Office for National Statistics data, these boroughs experienced the highest appreciation:
Waltham Forest leads with a 119% increase, jumping from £235,210 to £515,320. The borough benefited from the Elizabeth Line and regeneration in areas previously considered secondary markets.
Barking and Dagenham saw 113% growth (£167,410 to £356,960), transforming from one of London’s most overlooked boroughs into a first-time buyer hub.
Newham doubled prices over the decade (100% growth, £214,080 to £429,230), with the Olympic Park redevelopment and improved transport links driving demand.
Bexley and Havering both registered 96% growth. These South East and East London boroughs offer suburban character with accessible city connections — average prices rose from around £207,000-£223,000 to £406,000-£437,000.
Croydon increased 92% (£225,660 to £433,340), supported by regeneration projects and excellent transport infrastructure.
Lewisham rose 90% (£245,170 to £465,350), blending urban amenities with green spaces.
City of London appreciated 89% (£492,810 to £931,090), though from a higher base price reflecting its status as London’s financial district.
Hackney gained 86% (£344,670 to £642,700), with areas like Shoreditch becoming cultural and residential hotspots.
Greenwich completed the top ten with 84% growth (£241,610 to £444,350), combining historic appeal with modern regeneration.
Why These Areas Are Seeing Strong House Sales
Several factors converge to explain where house sales are strongest:
Affordability drives demand. With cost-of-living pressures ongoing, buyers gravitate to areas where budgets stretch further. Colleen Babcock, property expert at Rightmove, explains: “There is typically a larger pool of buyers looking to move within more affordable price brackets. As a result, locations with more homes priced below the average asking price often see higher demand, which supports stronger house price growth.”
Commuter accessibility matters. Many top-performing areas sit on the edges of major cities – Durham near Newcastle, Seacroft near Leeds, Anlaby near Hull. With employers requesting more office attendance, buyers seek reasonable commuting distances without city-centre price tags.
Dan Mirfin, branch manager at Manning Stainton Beeston, notes: “Areas such as Beeston are seeing strong price growth because they sit at the intersection of affordability, connectivity and long-term demand. Beeston remains comparatively good value for money for first-time buyers, particularly when compared to more established suburbs closer to the city centre, while still offering excellent transport links into Leeds.”
Regeneration creates opportunity. Long-term investment in housing, infrastructure and public spaces attracts attention. John Baybut, Managing Director at Berkeley Shaw Real Estate in Liverpool, says: “Liverpool Football Club has been a key driver of regeneration in Anfield, committing long-term investment to the area. From an investor’s point of view, short-term lets in particular are delivering strong yields.”
Transport improvements reshape markets. London’s Elizabeth Line fundamentally altered East London’s property market. Better connectivity reduces effective distance to employment centres, making previously secondary locations viable for daily commuters.
Mortgage market conditions support movement. Average mortgage rates dropped to 4% in December 2025, the lowest since September 2022. According to Zoopla, many households can now borrow up to 20% more with the same income and mortgage rate compared to a year ago.
Regional Variations in House Sales Growth
The data reveals a clear north-south split.
North West England recorded 3.5% average price growth over 2025. Burnley topped the list at 5.5%, with Rochdale, Blackburn, Liverpool and Wigan all exceeding 4%. All these towns sit below the regional average of £205,400.
Scotland saw 2.9% growth, with 12 locations appearing in the top 50 strongest-performing areas nationally.
Yorkshire & The Humber contributed eight locations to the top 50, reflecting strong house sales across the region’s affordable housing stock.
North East England gained 3.4%, with Durham and Benton both featuring in the top 10.
London recorded a 0.7% decline overall, though this masks variation across boroughs. The capital has 14% more homes for sale than a year ago, creating a buyers’ market. Higher stamp duty costs and affordability pressures weigh on house sales activity.
South East England fell 1.6%, while the South West dropped 0.1%. These regions face similar challenges to London: high prices relative to incomes, increased stamp duty burdens, and greater housing supply.
Northern Ireland led the UK with 7.6% growth, coming off a lower base.
What This Means for Buyers
Buyers willing to look beyond traditional hotspots find opportunities. Many of the strongest-growing markets remain affordable, with room for appreciation before reaching regional or national averages.
Those open to suburbs, commuter towns or emerging regeneration areas may access better value and stronger growth potential. First-time buyers particularly benefit from these dynamics, entering markets where house sales momentum exists but prices haven’t peaked.
Location flexibility matters more than ever. With employers requiring office attendance, balancing commute times against property costs becomes the key calculation.
What This Means for Sellers
Sellers in areas experiencing rising demand and strong house sales volumes may find conditions favour quick sales and competitive offers. Increased buyer interest can drive multiple offers, particularly when properties are priced realistically.
In slower markets with higher price points, strategy shifts. Competitive pricing from the outset matters more than testing the market high. Zoopla data shows that sellers who cut prices by 5% or more take almost double the time to sell – 43 days on average – compared to those priced correctly initially.
Presentation and staging play bigger roles in saturated markets. With buyers enjoying more choice, homes need to stand out from competing listings.
Location also determines how quickly house sales are completed. Properties in northern England sell in an average of 32 days, while southern regions see longer marketing periods due to higher supply and price sensitivity.
The Cash Buyer Advantage in Growth Markets
Cash buyers play a distinct role in areas experiencing strong house sales growth. Cash purchases accounted for 19% of UK transactions in 2025, unchanged from 2024. Regional variation tells a more nuanced story.
The North East recorded the highest proportion of cash buyers at 24%, while London registered the lowest at 14%. Scotland followed at approximately 23%, with the North West and Yorkshire showing above-average cash buyer activity.
Cash buyers secure significant discounts in growth areas. Data from Property Sale Watchdog shows cash purchasers paid an average of £28,189 less than mortgage-dependent buyers in September 2024 – a 9.3% discount.
The North West offers the largest discounts at 13.4% (around £31,827), followed by Scotland at 12.8% and the North East at 12.4%. These are precisely the regions where house sales growth has been strongest, creating a reinforcing cycle: cash buyers target affordable, high-growth areas where they can negotiate better deals, which in turn drives more rapid house sales completion and market velocity.
Yorkshire & The Humber provides 7.7% average discounts, the East Midlands 6.4%, and Wales 5%. London is the only region where cash buyers pay a premium (around £15,344 more on average), reflecting foreign investor activity in high-value properties.
Speed drives the cash buyer premium. The average house sale in England and Wales takes 152 days from offer acceptance to completion. Cash buyers complete in 7-21 days through specialist house-buying companies, or 4-6 weeks through traditional routes. This certainty appeals strongly to sellers in competitive markets or those facing time pressures.
First-time buyers increasingly compete against cash. Nationally, 10% of first-time buyers purchased without mortgages in 2025. This represents either parental assistance, inheritance windfalls, or buyers who’ve saved aggressively in lower-cost regions. First-time buyers now account for 58% of all transactions, but those relying on mortgages face longer timelines and higher rejection rates from sellers prioritising speed.
Investment buyers focus cash purchases on high-growth areas. Buy-to-let investors and portfolio landlords concentrate on cash buying in areas showing strong rental yields and capital appreciation. Liverpool’s Anfield, where house sales rose 11% and regeneration drives rental demand, attracts significant cash investor interest. The combination of lower entry prices, strong growth trajectory, and rental income potential makes these markets particularly attractive for cash deployment.
Cash buyers in growth markets benefit from three advantages: negotiating power through speed and certainty, access to properties that might otherwise favour chain-free purchasers, and positioning in appreciating markets before prices peak. For sellers in these areas, accepting cash offers despite lower headline prices often results in faster completions and reduced fall-through risk — a calculation that matters more as supply increases.
Current Market Activity
According to Zoopla, the UK housing market recorded healthy activity in early 2026:
- Average UK house price: £269,800 (up 1.2% annually)
- Total homes for sale: 6% higher than last year
- Average estate agent stock: 34 properties (highest in eight years)
- Buyer demand: rebounded to match 2024 levels after Autumn Budget uncertainty
Sales activity measures run 10-11% higher than a year ago, supported by improved mortgage affordability and stabilising rates.
Looking Ahead
Current trends suggest the north-south divide will persist. Areas with lower prices relative to regional incomes will continue seeing stronger house sales activity, while higher-priced southern markets face headwinds from affordability constraints.
Mortgage rate stability at around 4% provides buyers with predictable borrowing costs. Combined with relaxed affordability checks, this supports continued activity in markets where prices align with local incomes.
Supply levels remain elevated, particularly in London and the South East. This gives buyers negotiating power and makes realistic pricing critical for sellers wanting to complete house sales without extended marketing periods.
Regeneration projects will keep reshaping local markets. Areas benefiting from infrastructure investment, transport improvements or major development schemes will likely outperform comparable locations without these catalysts.
Key Takeaways
- House sales growth concentrated in affordable areas, with 43 of the top 50 locations priced below the national average.
- Northern England and Scotland dominate recent performance, with Hawick (+18%), Durham (+15%) and Stannington (+12%) leading.
- London’s growth story spans a decade, with East and South London boroughs seeing 84-119% appreciation since 2013.
- Affordability, commuter access, regeneration and transport improvements drive where house sales activity concentrates.
- Buyers have more choice than in eight years, with total housing stock up 6% year-on-year.
- Sellers in slower markets need competitive pricing from the outset, as delayed price reductions nearly double the time to sell.
- Mortgage rates at 4% (lowest since September 2022) support continued buyer activity in affordable markets.
- Cash buyers represent 19% of UK transactions, with the highest concentration in the North East (24%) and lowest in London (14%).
- Cash purchases secure average discounts of 9.3% nationally, rising to 13.4% in the North West, where house sales growth is strongest.
Frequently Asked Questions
Q1: Which UK region has the strongest house sales growth currently?
The North West of England leads with 3.5% annual growth, though Northern Ireland tops regional performance at 7.6%, coming from a lower base. Burnley, Rochdale, Blackburn, Liverpool and Wigan all recorded growth exceeding 4%.
Q2: Why are northern areas outperforming southern regions?
Affordability drives the divergence. Northern properties remain accessible to a larger buyer pool, while southern England faces affordability pressures from higher prices, increased stamp duty costs and elevated supply levels creating buyers’ markets.
Q3: What role does regeneration play in house sales growth?
Long-term regeneration creates compounding effects. Areas like Anfield benefit from infrastructure investment, improved amenities and renewed buyer interest. Combined with lower entry prices, these locations attract first-time buyers, families and investors simultaneously.
Q4: How much have East London house sales values increased?
Waltham Forest leads at 119% growth since 2013, followed by Barking and Dagenham (113%) and Newham (100%). All three benefited from transport improvements, particularly the Elizabeth Line, and large-scale regeneration projects.
Q5: Are higher-priced areas seeing house sales decline?
Not decline, but slower growth or stagnation. London fell 0.7% over 2025, the South East dropped 1.6%, and the South West decreased 0.1%. Affordability limits, higher stamp duty and increased supply all contribute to weaker performance.
Q6: What’s the average time to sell a property in 2026?
England and Wales average 36 days from listing to agreement, with 52% of homes selling within two months. Northern England averages 32 days, while properties in southern regions and coastal areas take longer due to higher supply and price sensitivity.
Q7: How do transport improvements affect house sales?
Significantly. The Elizabeth Line transformed East London’s market, making previously secondary boroughs viable for city commuters. Better transport reduces effective distance to employment centres, expanding the pool of potential buyers for affected areas.
Q8: Should first-time buyers focus on these growth areas?
First-time buyers benefit from entering markets with momentum and accessible prices. Areas in the top 50 for growth, averaging £270,711, offer room for appreciation while remaining below the national average of £368,031, providing entry points with growth potential.
Q9: What mortgage rate changes have impacted house sales?
Rates dropped to 4% in December 2025 (lowest since September 2022). With relaxed affordability checks, many buyers can now borrow up to 20% more than a year ago, given the same income and rate, supporting increased house sales activity.
Q10: What discount do cash buyers receive in high-growth areas?
Cash buyers nationally average 9.3% discounts (£28,189 less than mortgaged buyers). The North West provides the largest discounts at 13.4% (£31,827), followed by Scotland (12.8%) and the North East (12.4%). These regions align with areas seeing the strongest house sales growth, as sellers prioritise completion certainty over headline prices.
Q11: How important is pricing strategy in the current market?
Critical, particularly in slower markets. Sellers who overprice and later reduce by 5%+ take nearly double the time to sell (43 days vs initial realistic pricing). With 6% more homes competing for buyers, accurate initial pricing matters more than testing the market high.
Related articles